
 |
NEW WEBSITE: FORUM FOR A NEW PARADIGM
Keeping the Farmer on the Land
by Frank Endres
July 2013
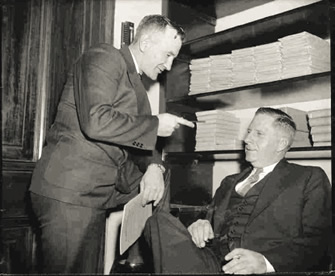
EIRNS/Daniel Platt |
[This article in PDF format, from EIR]
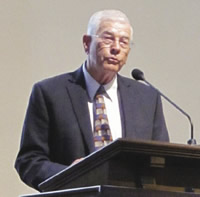
Frank Endres is a leader in the national farm movement to bring back a commitment to keeping the farmer on the land, and restoring our nation’s true sovereignty in these policies. His family has been farming land in California for generations.
The presentation that I’m going to make is one that we are showing to farmers all over the country. The purpose of the presentation is to debunk some of the ideas that have misled the farm people, the food producers of this nation, for a number of years. And we call that “Adventures in Facts.” It is primarily designed to show at house meetings and general meetings like this, to explain to farmers that they don’t need to be taking the low prices that they are getting today.
One of the things that we are going to be talking about—it’s quite buzzword today all over the country—and that is, “food security.” They’re all talking about food security. And they’re concerned about the nation now losing our farmland. We’ve lost almost 1 million acres of farmland a year in the United States since the 1960s, and there’s a lot of concern about preserving farmland. And they’re passing ordinances; we have the Williamson Act here in California, that gives farmers a break on their property taxes if they keep their land in production; and there are different ordinances around the country, that are trying to encourage farmers to stay on the farms and keep the farmland in production, rather than selling it for development (Figure 1).
FIGURE 1
|
 View full size
 The loss of our farmland amounts to 5,400 acres every day, or 200 acres an hour—it’s a tremendous loss. A lot of the farmland that is being lost is not just the prime farmland surrounding cities and that sort of thing. There’s a lot of farmland that’s being lost out in the country, where there’s really not much development. A land speculator will come out and, let’s say, will buy up a nice 320-acre parcel of land. And the first thing he does to make a big profit on it, is divide it up into 20-acre parcels and sell it off.
The first thing that happens, is that the new owner will put a fence around his 20 acres. As soon as he does that, that land is no longer in production. It can’t produce cattle, pasture, or food crops, because it’s not practical to farm a little 20-acre parcel.
So, what we’re saying is, that if you want to preserve farmland, the number one thing you’ve got to do, is save the farmer on the land first. It does no good to preserve the farmland if the farmer’s going broke on the land. So that’s what we’re doing.
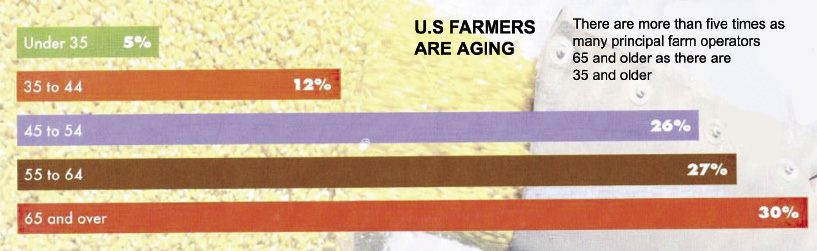
An Aging Farm Population
A big concern to the people is the aging of our farm population (Figure 2). About 5% of the population is under 35; on the other end are people over 65, which is 30% of the farm population. The farm population is aging, and the young people are not coming in to operate our farms. So, what we’re saying is, the farmer has to be able to make a living off the land, and the farm prices need to be at a parity level with the rest of the economy, to encourage the young people to come in and take over the farms.
FIGURE 2
|
FIGURE 3
|
 View full size
 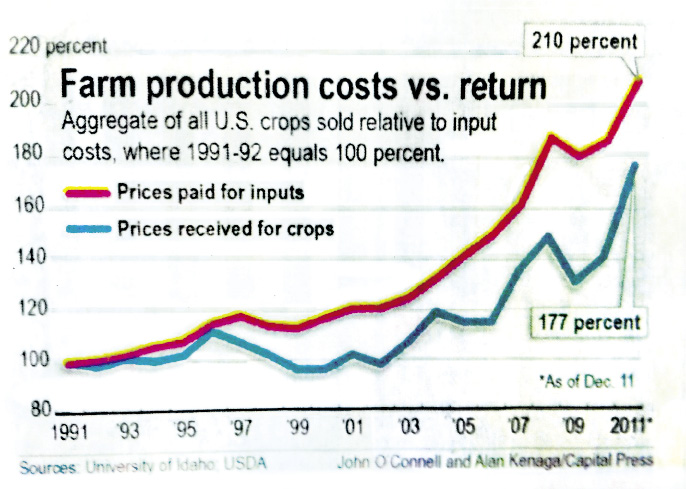 View full size
 One of the things that you’ve probably heard a lot about this year, is the higher grain and cattle prices, and this sort of thing. And I clipped this article out of a farm paper, and it shows that the farm prices have risen 177% since 1991, but also, the costs have risen by 210% (Figure 3). Now, there’s a little fallacy in this chart: Back in 1991, our farm prices were not at 100% of parity. They were approximately 50% of parity, and if they would have shown that in this chart, the spread would have been even greater.
Most businesses, as well as farming, have a formula, and that formula is: Production times Price equals Income. So any decrease in production or in price will drastically affect your income.
Supply and demand: We’re told that this is what governs our prices, and so what we would like to do, is show you how that’s not working today. World population today is approximately 7 billion. The acres of farmland per capita is, for the general population of the world, approximately fifty-five hundredths of an acre—that’s half an acre per capita that is being used today to feed the population. And when you put that in context of what the world population is going to be, it’s quite astounding.
In the United States alone, the present population is around 315 million people, and the projection is that, by the year 2050, which is only 37 years from now, they expect that our population is going to increase by another 100 million people. Most of our economic theory has been supply and demand; this is what the farmers are told—that supply and demand is what governs your prices, and you dumb farmers, you overproduce every year, and so that’s why you can’t expect to get a decent price for your commodity or your animals, because you just produce too much.
That theory is taught in the colleges and the universities like it’s the theory of gravity: You throw a rock up and it falls down. Well, the same thing with the law of supply and demand. When your production goes up, naturally your prices are going to go down.
Adam Smith’s ‘Invisible Hand’
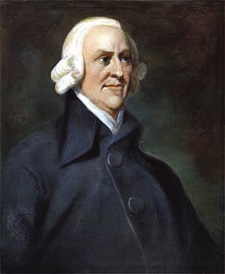
Adam Smith let slip that his theories only work when both parties to the transactions are dealing from a position of equal strength. The East India Company apparently didn’t get the message. |
That theory was originally formulated by a fellow by the name I’m sure all of you heard of, Adam Smith, back in the 1700s. He was what is known as a court economist. And we have court economists today, who preach the same thing.
Adam Smith was a favorite of the British Crown at that time, because in all their colonies, all over the world, you had to have some way of explaining why they would literally steal the commodities, and take them back to England, and manufacture them, and then attempt to sell them back to their colonies. And so they had to have some way of explaining that away to the colonists at that time, and so Adam Smith’s theory fit quite well!
And then when he couldn’t explain it, he said, well, there’s an “invisible hand” in the marketplace that’s controlling it. It almost makes it sound like it’s something divine is coming down from the Heavens. So, that’s one theory of how farm prices are made, and the same thing is pulling the wool over the farmers’ eyes today.
And to back up just a minute: Adam Smith let slip, in one of his theories, that his theories only work when both parties to the transaction are dealing from a position of equal strength. And when you look at the British East India Company, which did all the trading with the colonies for the British Crown at that time—that, most certainly, wasn’t equal strength. If any other country would attempt to go in and trade with some of their colonies on some of the major commodities, the British Empire would send their forces, their Navy and their Army, in there, and would stop them from doing trade with those colonies.
Carl Wilken and the ‘Golden Era’
Carl Wilken (1895-1968), standing, is credited with bringing a “Golden Age” to agriculture. |
But there’s another man who’s very significant, because his efforts produced what is called the “Golden Era” for agriculture; that was the period from 1941 until 1952. Carl Wilken was a farmer in Iowa, and he had training from the University of Iowa; and he really liked getting into economics, and found that agriculture has a multiplier, as do all segments of our economy. But agriculture had the highest multiplier, and he found that for every dollar that’s generated on the farms, that the national economy ended up with $7 of new wealth. And when he found this, he became a one-man evangelist, so to speak, and spent countless hours all over the country, giving seminars on how this operated.
In 1941, when Pearl Harbor was bombed, within a couple of days, they had passed the National Defense Act, there was such fever to go to war at that time. He got 13 state secretaries of agriculture together in Washington, and he gave a one-day seminar, and showed them why we need to have parity prices for agriculture: because, number one, we’ve got to feed the nation, as well as the military; we’ve got to produce the food for the war effort. But more importantly, we have got to produce the income to pay for this tremendous war effort.
And so, as a result of that, he got Senator [Henry] Steagall—here it’s a coincidence again—Senator Steagall, to tack onto the National Defense Act, what is called the Steagall Amendment, that simply stated that all farm commodities would be priced at 100% of parity. And because of that, they were able to stabilize agriculture, encourage food production, and also to pay for the war effort at that time. And this act went from 1941 to 1952.
TABLE 1
Parity Ratio for Farmers: Prices Received to Prices Paid, 1929-1969
|
 View full size
 But there were no farmers involved in getting that act passed at that time, to keep it in force, and so it was repealed, and they substituted a sliding-scale parity. And when that happened, the farm prices just began to skid downhill.
And during that time period, from ’41 to 1952, that policy caused a depression in one segment of our economy. Can anybody guess what that is? It was the banking industry. The bankers could only loan out 16% of their money. Why? Farming was the biggest industry in the country; farmers didn’t have to borrow from one year to the next to plant their crops or do anything else. It was paid for by the income from their farms.
And so, the farmers and people in rural areas were depositing money in the bank, and taking interest from the banker. And then, in 1952, when the law was rescinded, in one year, the loan-to-deposit ratio in banks, jumped to 32%.
It’s very hard to see this, but basically what that is, if you have real sharp eyesight—I took out of the government statistics book, put out by the Department of Agriculture (Table 1): These are the parity prices; and it just shows what that was, during that time period. And that established a foundation for all the farms in this country that were established in that generation, and set the stage for all the farmers at that time to establish themselves.
Swords into Plowshares
Something very interesting happened during that period: The troops that returned from the war, many of them wanted to establish farms and become farmers. They could go out and buy a farm, and if they were good farmers, they could pay for that farm from the crops that they would raise and sell. So this helped establish the farm population at that time; they could go out and making a living in rural America.
TABLE 2
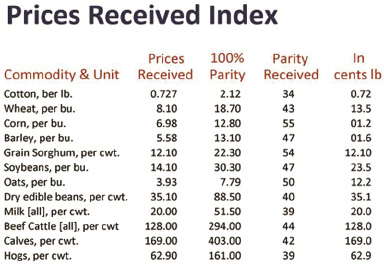 |
The Prices Received Index (Table 2) is just a gauge of what they were receiving on the parity scale. Parity: Everybody uses parity in our economy, everybody, but they just call it by a different name; for farmers it’s “parity.” For university teachers, for firemen, policemen, and so on, it’s “cost of living wage.” And so, the cost of living wage for the farmer is called parity. And if you’re receiving 100% parity for your crops and your cattle, then that is a full, fair wage, comparing the selling price of your commodities compared to what your input costs are to raise it. That’s simply what parity is.
Lately, it’s dropped down, on the average, to about 50% of parity, and that does not encourage the young people to go into agriculture, and it does not encourage the farmers to keep their land, if they can sell it for development or whatever.
Some people say, well, gosh, basically what you’re asking here is, that we’re going to have to double the price of our commodities, to bring it to 100% parity, and what you’re saying is, “My God, we can barely afford our food right now, how’re you going to double the price?”
FIGURE 4
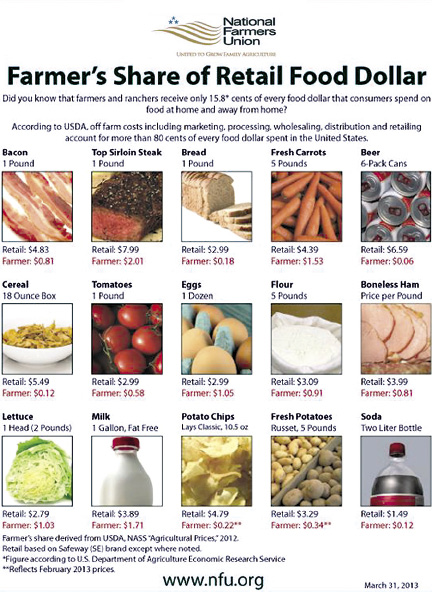 |
Look at four major commodities from Figure 4, just to show you how small an increase that is: Bread, a one-pound loaf of bread that retails for $2.99—the farmer gets 18 cents out of that, for the basic raw material that’s in it. One gallon of milk is $3.88—the farmer gets $1.71 out of that—and he needs that. Dairymen desperately need to double that price; that needs to be doubled. But you’re only talking about the basic raw material that’s going to change, not the entire cost. This is where people have been misled on the consuming side, on what these prices will mean. You’ve got a sirloin steak there, retailed at $7.99—the farmer only got $2.01 out of that.
And the more processed the food commodity, such as cereal, for example, the greater the disparity is. Retail on cereal is $5.49; the farmer only got 12 cents out of that. The 12 cents is the only part that we’re talking about, that needs to be increased, not the entire thing.
Of the top processors in the period from 1995 to 2010, 43% of the dairy processing sales were by co-ops. By 2010, no top four were cooperatives any more. These are all large corporations that are doing the processing now.
Of the top processors in 1995, there 10% of sales were from foreign owned companies; in 2010, two foreign companies in the top four.
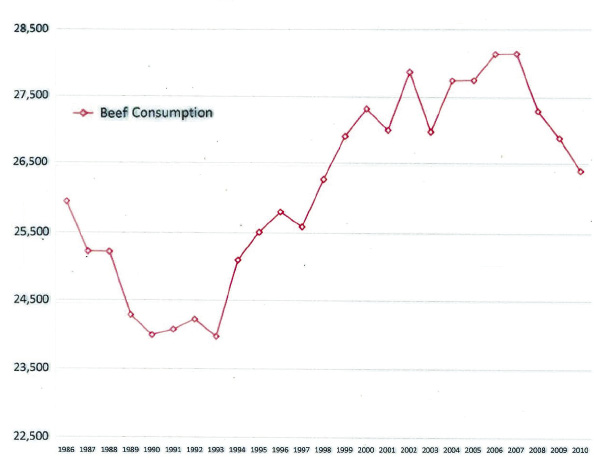
Decline in Beef Consumption
This is really shocking (Figure 5): This is the consumption of beef in this country. We have an assessment that’s made against all of us beef producers. We pay a $1 a head to the promotional board to get people to eat more beef; the consumption of beef, as you can see on this chart, had steadily been increasing. It dropped off a little bit in 2000, and in 2010 or so, but that’s mainly because of the recession.
FIGURE 5
Beef Consumption
|
FIGURE 6
Beef Consumption Exceeds Production
|
 View full size
 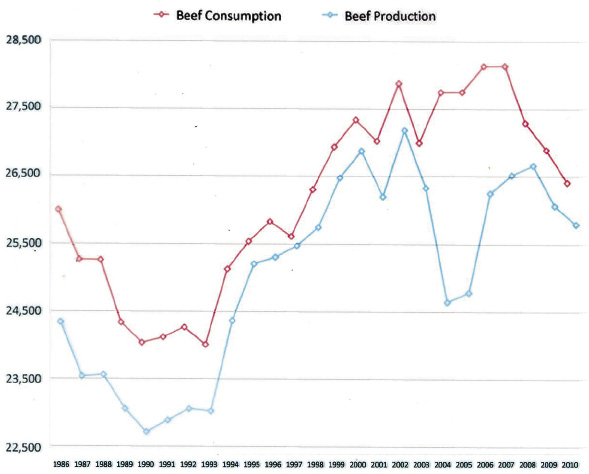 View full size
 The bottom line there (Figure 6) is the production of beef in this country; and at no time, at no time do those lines touch; in other words, we’re consuming more beef than we’re producing in this country. If supply and demand had anything to do with it, as Adam Smith said—that supply and demand governs your price—the cattlemen should be doing very well for themselves—and they’re not! We’re losing cattlemen and cattle ranches all over the United States, because of the low price of beef, compared to what their production costs are.
TABLE 3
U.S. Wheat and Coarse Grains
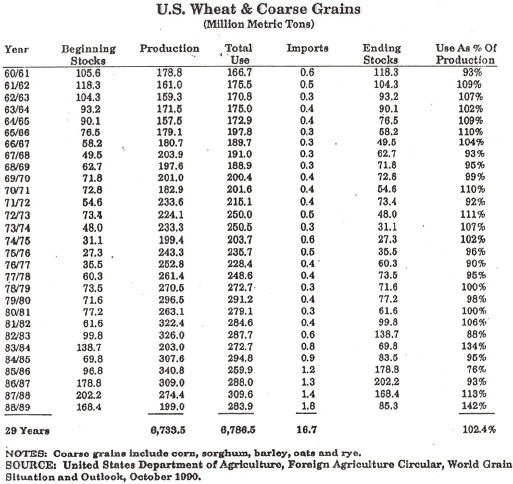 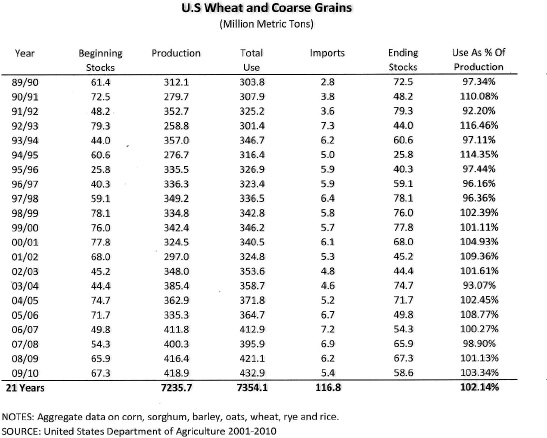 |
The wheat and feed grains—we’re not just talking one grain; we’re taking all seven of the major grains (Table 3). We total it up, and average the consumption of grains in this country; and it shows that, for a 50-year period, we are consuming an average of 102% of our total production.
Now, you’re saying, “W-w-well, wait a minute, how can that be? How can you consume 102% of your total production?” What we do is, we adjust the imports and the exports to make up for that; so that’s what that comes from. That’s more of the same thing.
FIGURE 7
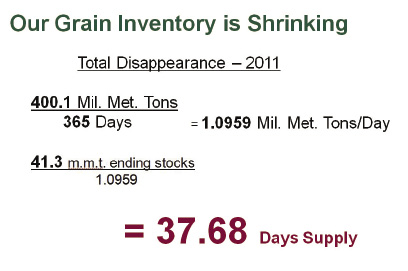 |
The grain inventory: At the end of each year, we have what they call a carryover of grain into the next year. And the latest that we have the figures for is 2011; it’s kind of like the rainfall records. You have to go around into the next year, before you can come up with a total figure (Figure 7). And the carryover in terms of consumption represents 37.68 days’ supply—that’s all we have. That’s all we have left over at the end of the year.
Now, you’ll note, that that was in 2011! This is not taking in 2012 yet. Now 2012, that hasn’t come around yet, the full crop year—that represents the drought year in the Midwest! So that figure, I think, will probably be cut in half. Heaven forbid if we have another drought in the Midwest! We’re dangerously close in this country, and food security is a real concern.
I think that covers most of what I would like to present. It goes on here for quite a while, and I know you people want to get out and get something to eat now!